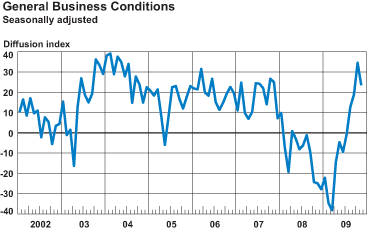
November 2009 Report
Survey Indicators
Seasonally Adjusted

The Empire State Manufacturing Survey indicates that conditions for New York manufacturers improved in November, but at a somewhat slower pace than in October. The general business conditions index fell 11 points, to 23.5. The indexes for new orders and shipments posted similar declines. Pricing pressures eased, with the prices paid index positive but lower than last month and the prices received index rising to a level just below zero. Employment indexes fell from October’s elevated levels, remaining slightly positive. Future indexes conveyed an expectation that activity and employment would improve in the months ahead and that both input and selling prices would increase significantly.
In a series of supplementary questions (see Supplemental Reports tab), respondents were asked about their cash holdings and debt financing. More than 40 percent of manufacturers expected cash holdings to increase over the next year, while 24 percent expected them to decline—in sharp contrast to results from an identical survey conducted a year ago, when more manufacturers had expected cash holdings to decline than to rise. Respondents were also asked about expected changes in their outstanding debt; in the current survey, 39 percent of manufacturers said that they anticipated declines, while just 16 percent expected increases—again, a noteworthy change from last year’s survey, when nearly as many respondents had anticipated increases as decreases in debt. In response to a related question on current cash holdings, 34 percent of firms said that they were currently holding higher than usual (excess) cash balances, up from 20 percent in the November 2008 survey.
Conditions Improve at a Moderated Pace
The general business conditions index remained positive for a fourth consecutive month, although it dropped 11 points, to 23.5, from October’s relatively strong level. Forty-three percent of respondents indicated that conditions had improved, while 19 percent reported that conditions had deteriorated. The new orders and shipments indexes both posted similar declines. The new orders index fell from 30.8 to 16.7, and the shipments index declined from 35.1 to 13.0. After turning positive in October, the unfilled orders index drifted back below zero, ending at -2.6. The delivery time index also fell below zero, to
-2.6. The inventories index remained near last month’s level, at -17.1.
Pricing Pressures Ease
Survey respondents faced less pricing pressure in November; input prices continued to rise and selling prices continued to fall, but the pace of price changes eased. The prices paid index posted its first decline in several months, falling 9 points to 10.5—a sign that the pace of price increases was slower in November than in October. The prices received index rose 3 points to -2.6, its highest level in a year, suggesting that selling prices fell at the slowest monthly pace in many months. Employment indexes increased significantly in October but gave up much of their gains in November, with both indexes remaining close to zero. The index for number of employees fell 9 points to 1.3, and the average workweek index fell 16 points to 5.3.
Manufacturers Expect Activity to Improve and Prices to Climb
The six-month outlook remained optimistic, with an expectation that business activity, inventories, and employment would rise in the months ahead. The future general business conditions index rose to 57.0, its highest level in several years. The future new orders index held steady at 52.4, but the future shipments index dipped to 48.9. The future inventories index climbed 13 points to 7.9, its first positive reading in more than a year, suggesting that some degree of inventory rebuilding is expected in the near future. Forward-looking price indexes rose sharply: the index for future prices paid climbed 24 points, to 48.7, and the index for future prices received rose 17 points, to 27.6. The index for future number of employees climbed to 30.8, while the future average workweek index held steady at 18.4. The measure for planned capital expenditures rose to 21.1, and the measure for planned technology spending rose to 14.5.


